Business year 2019
Business year 2019
Helen Group’s profit trend continued at an excellent level.
Helen Ltd was able to utilise the electricity market situation and increase the operating profit with successful measures in the electricity wholesale market.
The number of Helen’s customers continued to grow: household customer contracts exceeded the 500,000 limit, and about one-third of Finnish residents in all have access to Helen’s energy services.
Net sales for 2019 totalled EUR 914 million (EUR 930 million) and operating profit stood at EUR 176 million (EUR 131 million). Operating profit accounted for 19.3 per cent of net sales.
Net turnover, Helen Group 2019
Net turnover € 914 million
| % | |
|---|---|
| Electricity sale, total |
34 |
| Electricity transmission sale |
13 |
| District heating | 49 |
| Cooling | 2 |
| Other returns | 2 |
Investment
Helen is making investments to increase the use of renewable energy in district heat production, recycling of energy with heat pumps and improving the security of supply in energy networks in particular.
Helen Group's investments totalled EUR 69 million. The investments in the parent company’s production structure amounted to EUR 43 million. Of this amount, the investments in the district heating and district cooling networks totalled EUR 16 million. Investments in the electricity network stood at EUR 22 million.
Helen invested EUR 2 million both in Oy Mankala Ab and the tunnel network. The rest of investments were targeted at new services and hydro power production.
Investment in production plants by Helen
| % | |
|---|---|
| Climate-neutral production |
64 |
| Emissions reduction |
22 |
| Maintenance of production plants |
14 |
District heat and district cooling
District heat sales fell slightly on the previous year, standing at 6,556 GWh. On the other hand, the number of district heat connections grew, totalling 15,542.
The share of district heat in the heated cubic volume of buildings in Helsinki was 90.6 per cent.
At 173 GWh, the sales of district cooling energy fell slightly on the previous year. However, the number of district cooling connections increased: at the end of 2019 their total number was 432.
District heat sales
GWh
| Sales | |
|---|---|
| 2015 | 6019 |
| 2016 | 6633 |
| 2017 | 6606 |
| 2018 | 6702 |
| 2019 | 6556 |
District heat connection power
MW
| MW | |
|---|---|
| 2015 | 3304 |
| 2016 | 3344 |
| 2017 | 3401 |
| 2018 | 3408 |
| 2019 | 3445 |
Electricity sales
A total of 6,752 GWh of electricity was sold, up by 3 per cent on the previous year.
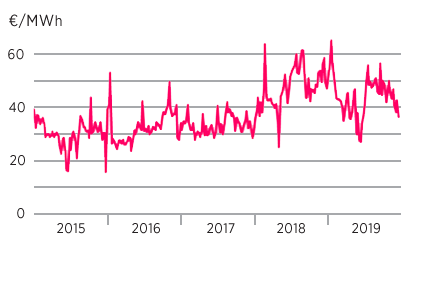
The market price of electricity remained high until late in the year. Price fluctuations were moderate during the year, and there were no particularly high or low short-term price periods. During December, the price of electricity fell significantly as a result of wet and warm weather conditions.
Spot price, Finland's area price
Electricity distribution
Electricity distribution in Helsinki was at the previous year’s level, standing at 4,383 GWh.
The reliability of the electricity network in Helsinki is outstanding. The average outage time of electricity distribution per customer was 1.5 minutes. The result is a European record.
Distribution of electricity consumption in Helsinki 2019
| % | |
|---|---|
| Outdoor lighting | 1 |
| Services | 57 |
| Electric rail | 4 |
| Industrial | 5 |
| Housing | 32 |
Consumption of electricity in Helsinki in total
| Consumption, GWh | |
|---|---|
| 2015 | 4317 |
| 2016 | 4424 |
| 2017 | 4404 |
| 2018 | 4413 |
| 2019 | 4383 |
Reliability of electricity distribution
| The annual interruption duration per client, minutes | |
|---|---|
| 2015 | 4.1 |
| 2016 | 1.9 |
| 2017 | 3.3 |
| 2018 | 4.9 |
| 2019 | 1.5 |
Electricity production for the wholesale market
A total of 6,540 GWh of electricity was produced for the wholesale market in the power plants in Helsinki and through power assets and procurement. This is slightly less than in the previous year.
The price of electricity, which grew in the summer, enabled an increase in natural gas production. On the other hand, the share of natural gas production at the end of the year was lower than anticipated, with the temperature remaining above zero.
The share of emission-free production of total electricity generation was about 36 per cent, while renewables accounted for 13 per cent. The production of hydropower plants was reduced further by a poor water supply situation.
| Origin of electricity | % |
|---|---|
| Coal | 30 |
| Nuclear power | 23 |
| Renewable sources | 13 |
| Natural gas | 34 |
Energy sources for district heat
| Source | % |
|---|---|
| Coal | 56 |
| Oil | 1 |
| Bio | 3 |
| Natural gas | 32 |
| Heat pumps | 8 |
Helen produced 6,994 GWh of district heat, which is slightly less than in the previous year. The beginning and the end of the year were warmer than normal and, as a result, heat production remained lower than expected.
Energy sources for district cooling
| Source | % |
|---|---|
| Heat pupms | 91 |
| Absorbtion | 6 |
| Compressors | 2 |
| Sea water | 1 |
Helen produced 173 GWh of district cooling, which is slightly less than in the previous year.
More information about production is available in the responsibility report.