Business year
The Helen Group’s net turnover registered a strong growth, but the result for last year was considerably below the previous year’s level.
The trend in net sales was affected especially by the record high market prices of electricity at the end of the year, which significantly pushed up the net sales of electricity. Operating profit was depressed by the highly increased price levels of energy procurement and emission allowances.
Net sales for 2021 totalled EUR 1.318 million (EUR 1.054 million) and operating profit stood at EUR 82 million (EUR 176 million).
Net turnover, Helen Group 2021
Net turnover € 1318 million
| % | |
|---|---|
| Electricity sale, total |
47 |
| Electricity transmission sale |
9 |
| District heating | 38 |
| Cooling | 2 |
| Other returns | 4 |
Investment
The Group’s investments totalled EUR 236 million. The parent company’s investments totalled EUR 174 million, of which the share of the Vuosaari bioenergy heating plant was EUR 113 million and that of the district heat and district cooling networks totalled EUR 38 million.
Investments in the electricity network totalled EUR 22 million. The investments of Tunneliverkko and Mankala were both EUR 2 million.
Wind power investments in Lakiakangas 3 totalled EUR 35 million and in Tupaneva EUR 2 million. Other investment areas were mainly new services and solutions.
Investment in production plants by Helen
| % | |
|---|---|
| Climate-neutral production |
79 |
| Maintenance of production plants |
21 |
District heat and district cooling
District heat sales grew by 18 per cent on the previous year, standing at 6,885 GWh. The number of district heat connections also continued to rise, totalling 15,864.
The share of district heat in the heated cubic volume of buildings in Helsinki was 90 per cent.
The sale of cooling energy grew by 18 per cent on the previous year, standing at 203 GWh. The number of cooling connections also increased: at the end of 2021, there were 494 in total.
District heat sales
GWh
| Sales | |
|---|---|
| 2017 | 6606 |
| 2018 | 6702 |
| 2019 | 6523 |
| 2020 | 5829 |
| 2021 | 6885 |
District heat connection power
MW
| MW | |
|---|---|
| 2017 | 3401 |
| 2018 | 3408 |
| 2019 | 3445 |
| 2020 | 3534 |
| 2021 | 3591 |
Electricity sales
Electricity sales amounted to 5,480 GWh. The amount of sales fell by 9 per cent year on year.
Since the summer, the market price level of electricity for 2021 was exceptionally high. At the same time, the prices grew strongly in the emission allowance and fuel markets. The electricity production amounts were also affected by the price of natural gas, which increased five-fold, and the price of emission allowance, which increased by 2.5 times during the year.
Spot price, Finland's area price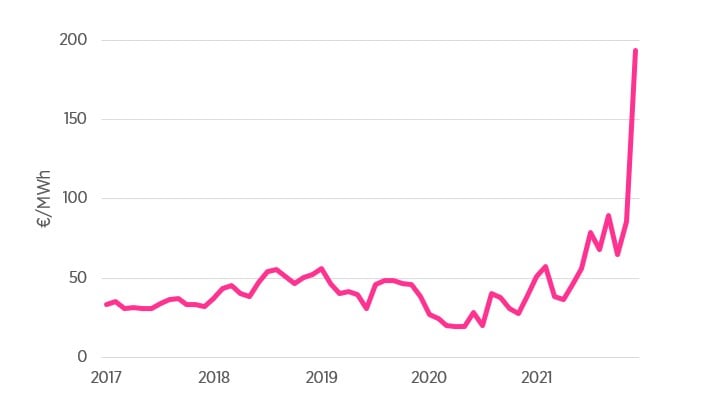
Electricity distribution
Electricity distribution in Helsinki grew by seven per cent year on year, to 4,473 GWh.
The reliability of the electricity network in Helsinki is at an excellent level. The average outage time in electricity distribution per customer was 4.7 minutes.
Distribution of electricity consumption in Helsinki 2021
| % | |
|---|---|
| Outdoor lighting | 1 |
| Services | 54 |
| Electric rail | 4 |
| Industrial | 5 |
| Housing | 36 |
Consumption of electricity in Helsinki in total
| Consumption, GWh | |
|---|---|
| 2017 | 4404 |
| 2018 | 4413 |
| 2019 | 4383 |
| 2020 | 4178 |
| 2021 | 4473 |
Reliability of electricity distribution
| The annual interruption duration per client, minutes | |
|---|---|
| 2017 | 3.3 |
| 2018 | 4.9 |
| 2019 | 1.5 |
| 2020 | 1.2 |
| 2021 | 4.7 |
Electricity production for the wholesale market
A total of 5,480 GWh of electricity was produced for the wholesale market in the power plants in Helsinki and through power assets and procurement.
The sale of wholesale electricity remained lower than predicted. One reason for the lower sales was the damage to the turbine in Hanasaari B.
The share of emission-free production of total electricity generation was 45 per cent, while renewables accounted for 18 per cent.
| Origin of electricity | % |
|---|---|
| Coal | 25 |
| Nuclear power | 27 |
| Renewable sources | 18 |
| Natural gas | 30 |
Energy sources for district heat
| Source | % |
|---|---|
| Coal | 46 |
| Oil | 5 |
| Bio | 8 |
| Natural gas | 30 |
| Heat pumps | 11 |
In 2021, our district heat production stood at 7,490 GWh, which is more than in the previous year.
The increase in production amounts is due to the cold weather at the beginning of the year and in December in comparison to the previous year.
District cooling production came to 171 GWh, which is slightly less than in the previous year.
Energy sources for district cooling
| Source | % |
|---|---|
| Heat pumps | 88 |
| Sea water | 5 |
| Compressors | 4 |
| Absorption | 3 |
More information about production is available in the responsibility report.